NZD/USD Price Analysis: Bears are lurking at the top of the week's rally
- NZD/USD bears could be about to pounce noting the trendline structures.
- If bulls commit, there will be prospects of a breakout to the 61.8% Fibo.
NZD/USD could be coming up for its last breath on Thursday for the high of the week. The following illustrates the structure of the market from a 1-hour perspective and a 15-minute scenario for the day ahead should the bears step in and the bulls capitulate towards the end of the week across the next few sessions.
NZD/USD H1 chart
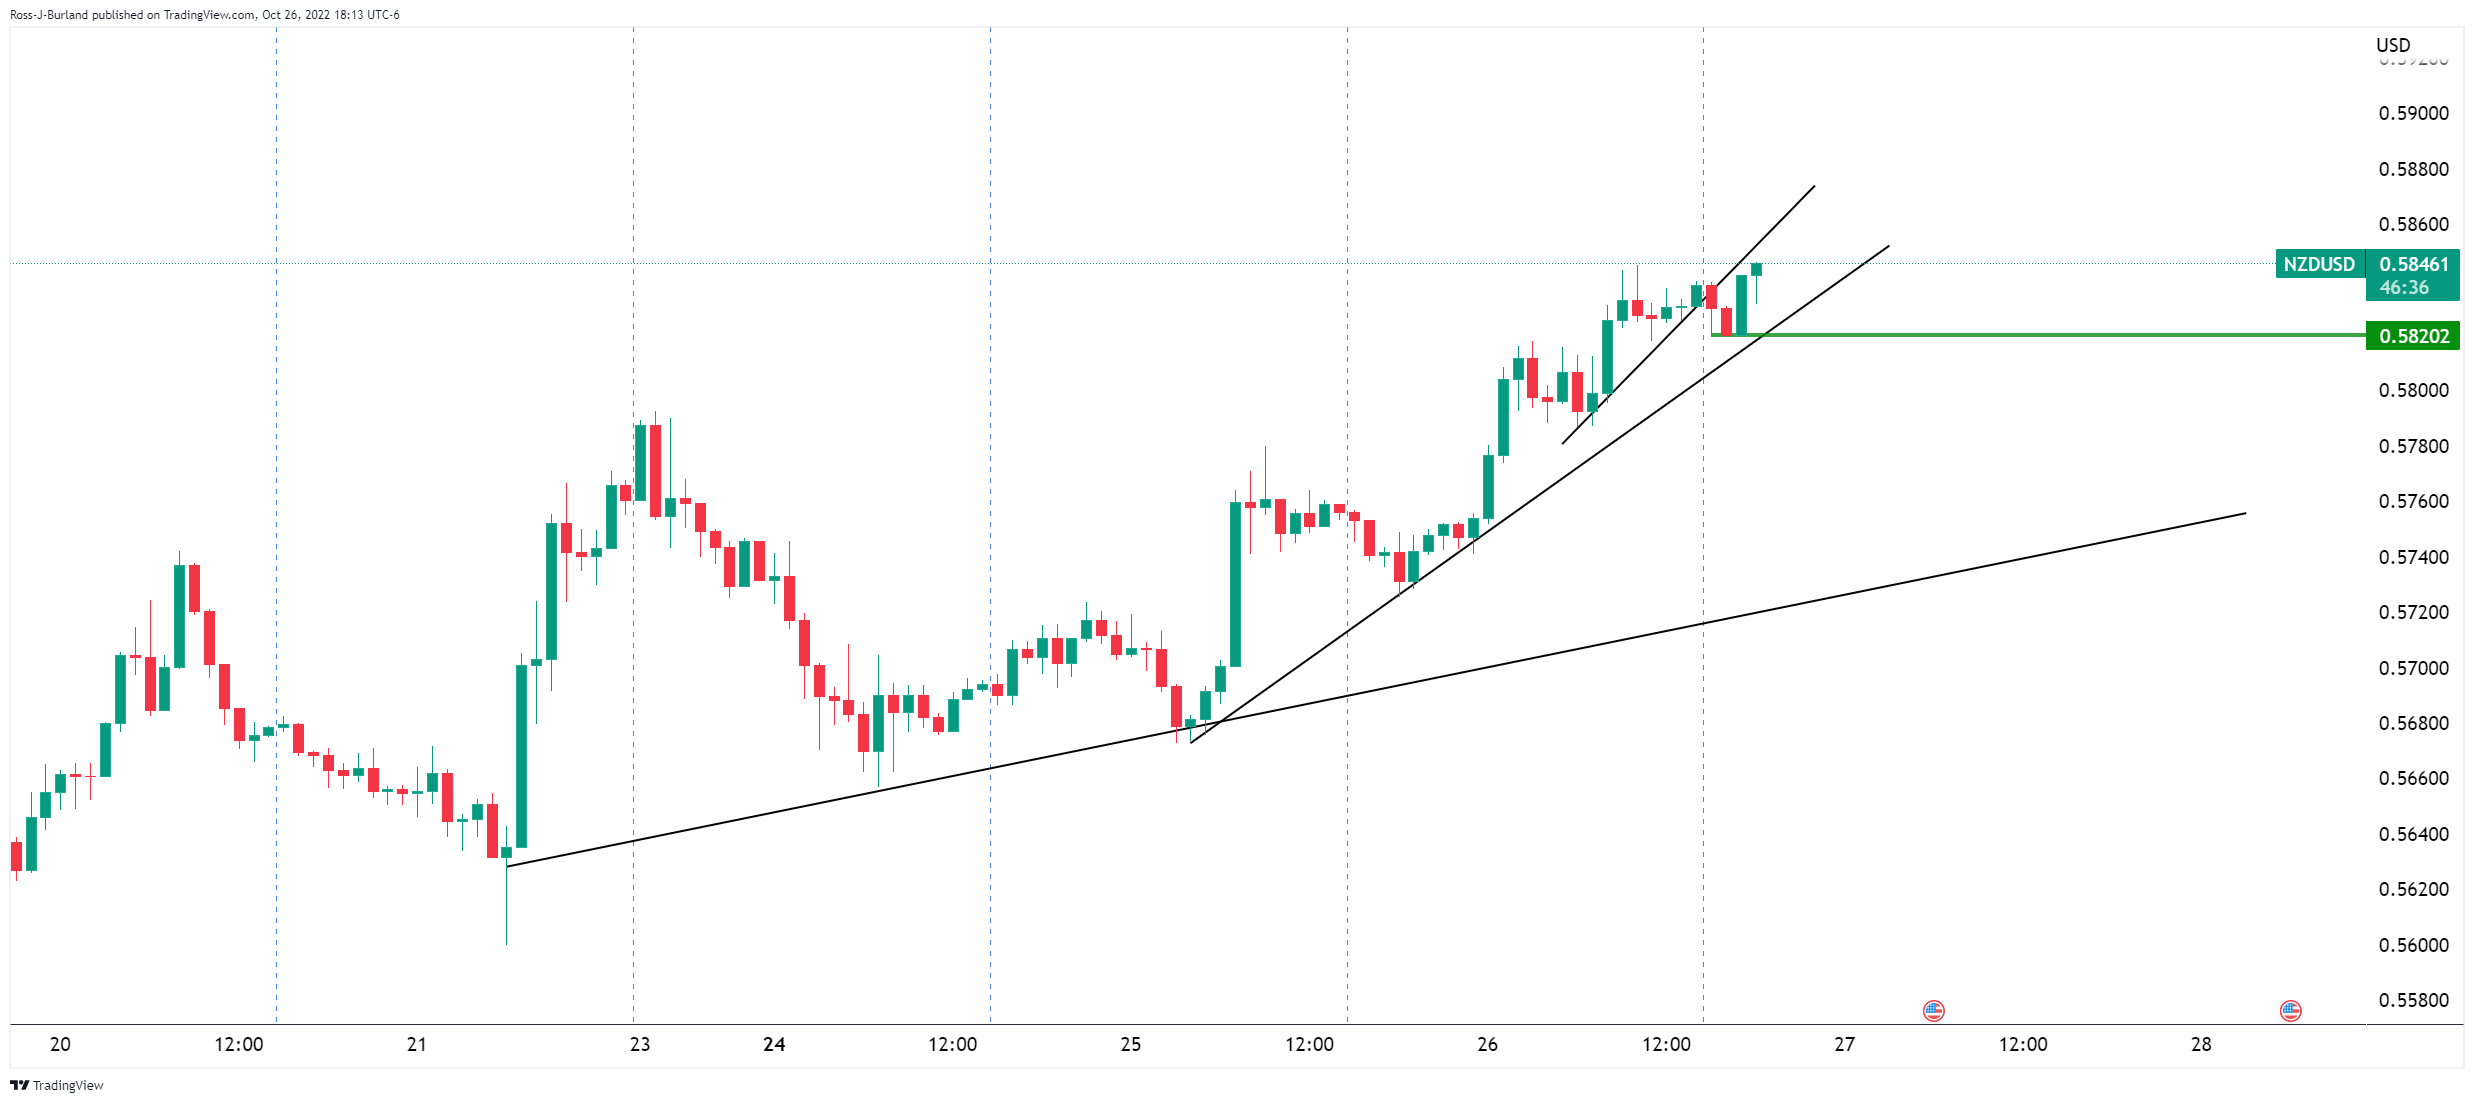
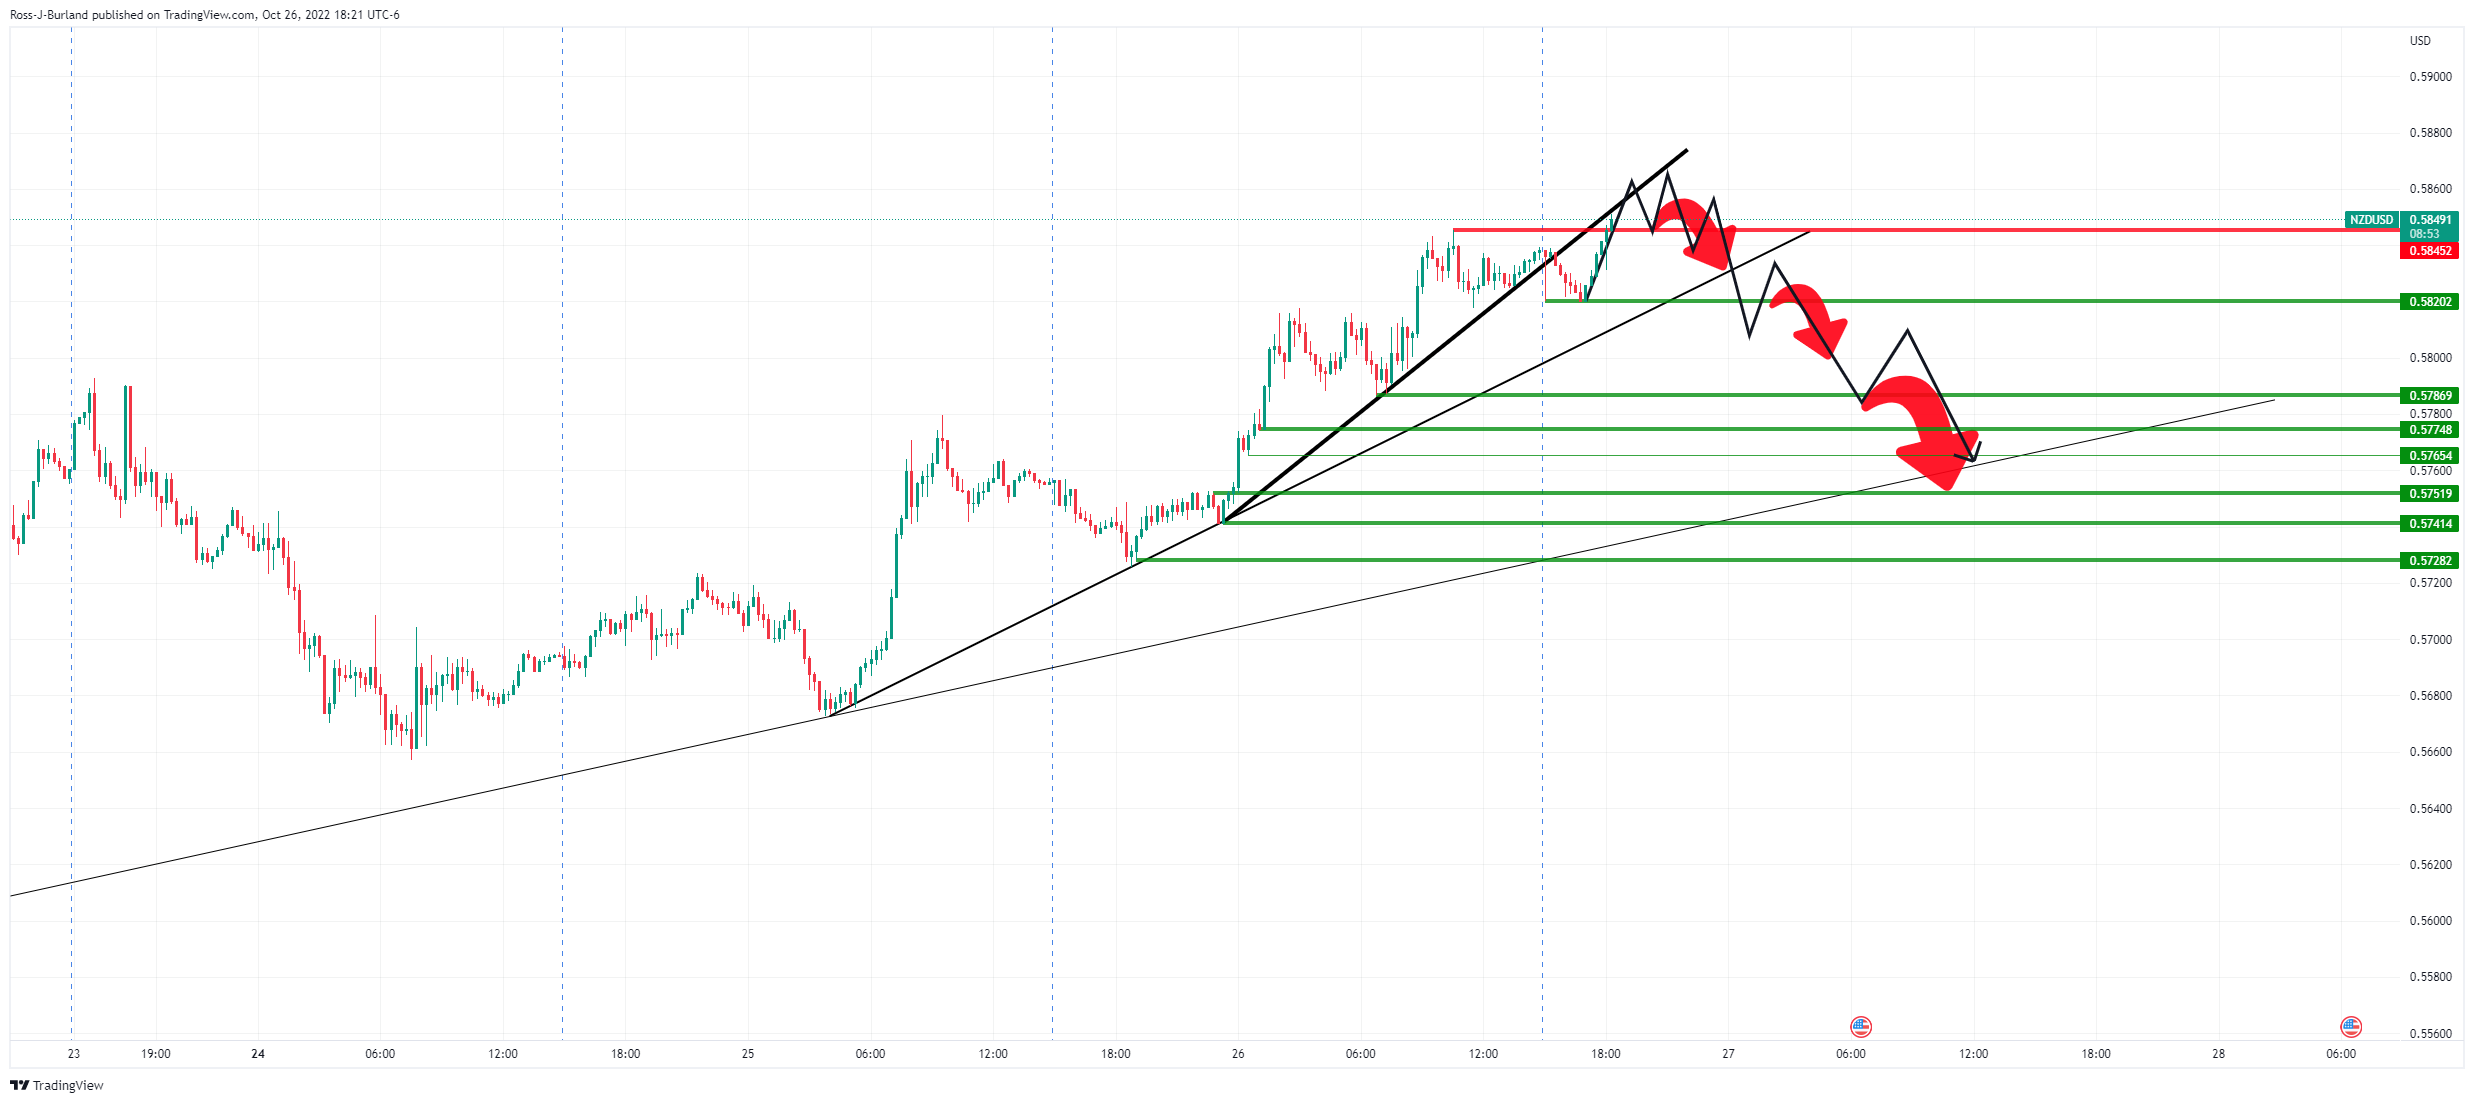
The price has carved out a climb-the-stairs trajectory over the past couple of days having pout in a potential low of the week on Monday while being in the process of putting a high of the week on Thursday. The micro trendline was broken in at the start of Asia day in the roll-over hour and we have seen a move into those shorts into Tokyo. This could eventuate in a peak formation for a top of the three-day series of higher highs and consequently lead to a slide as follows:
NZD/USD 15-min chart
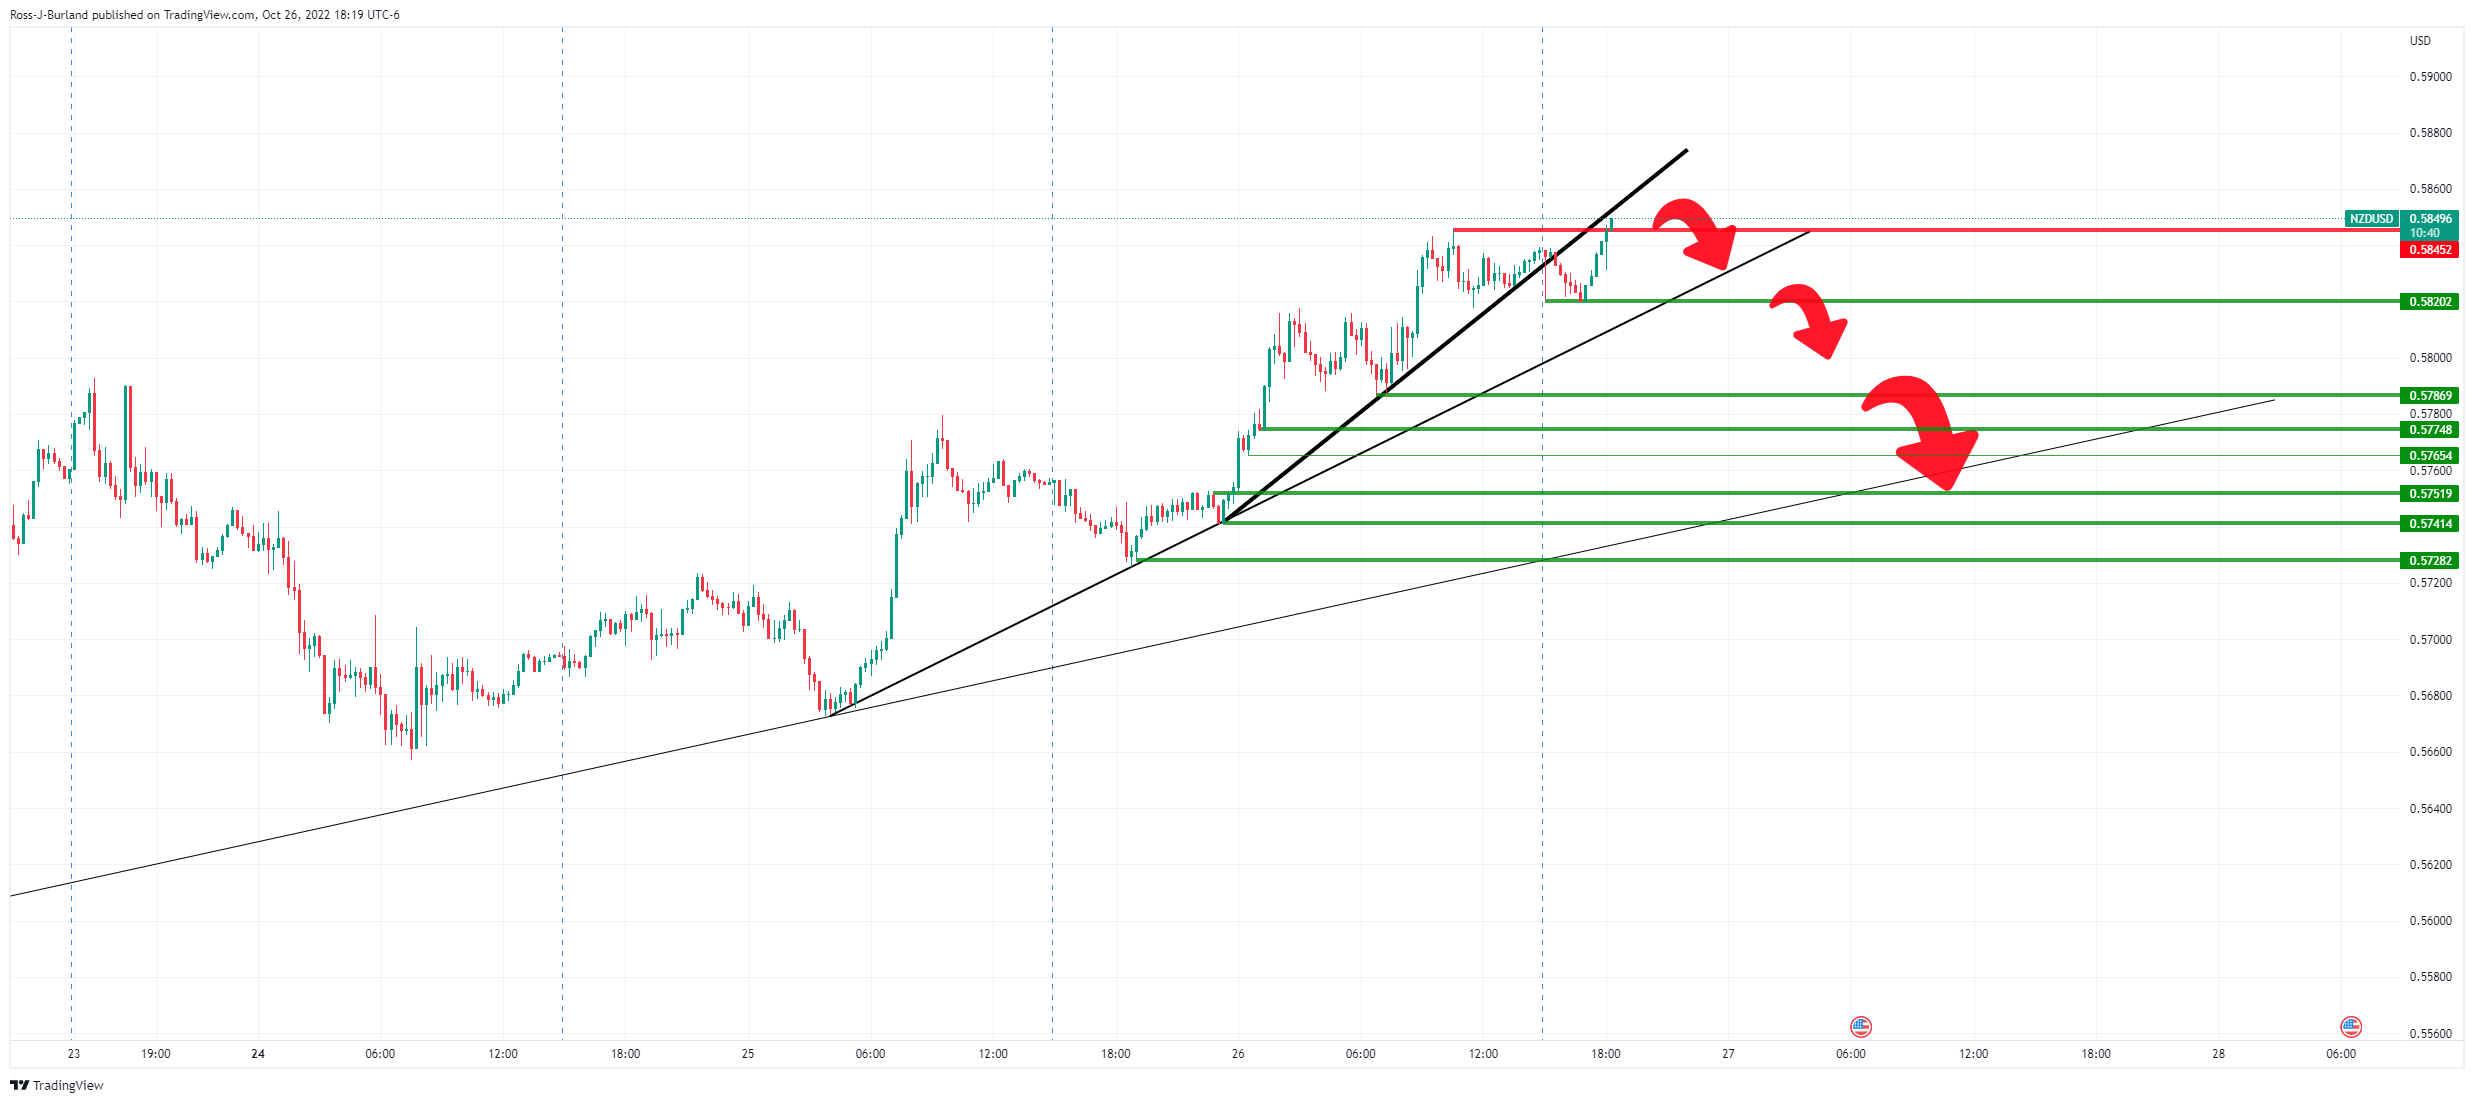
The 15-min levels are shown as 0.5820, 0.5787, 0.5775, 0.5765, 0.5750, 0.5740 and 0.5728 on the way down in what could be a cascade of market orders protecting long in-the-money positions. If there is to be a slide, if it isn't parabolic, then it could look something like as follows:
NZD/USD bullish scenario
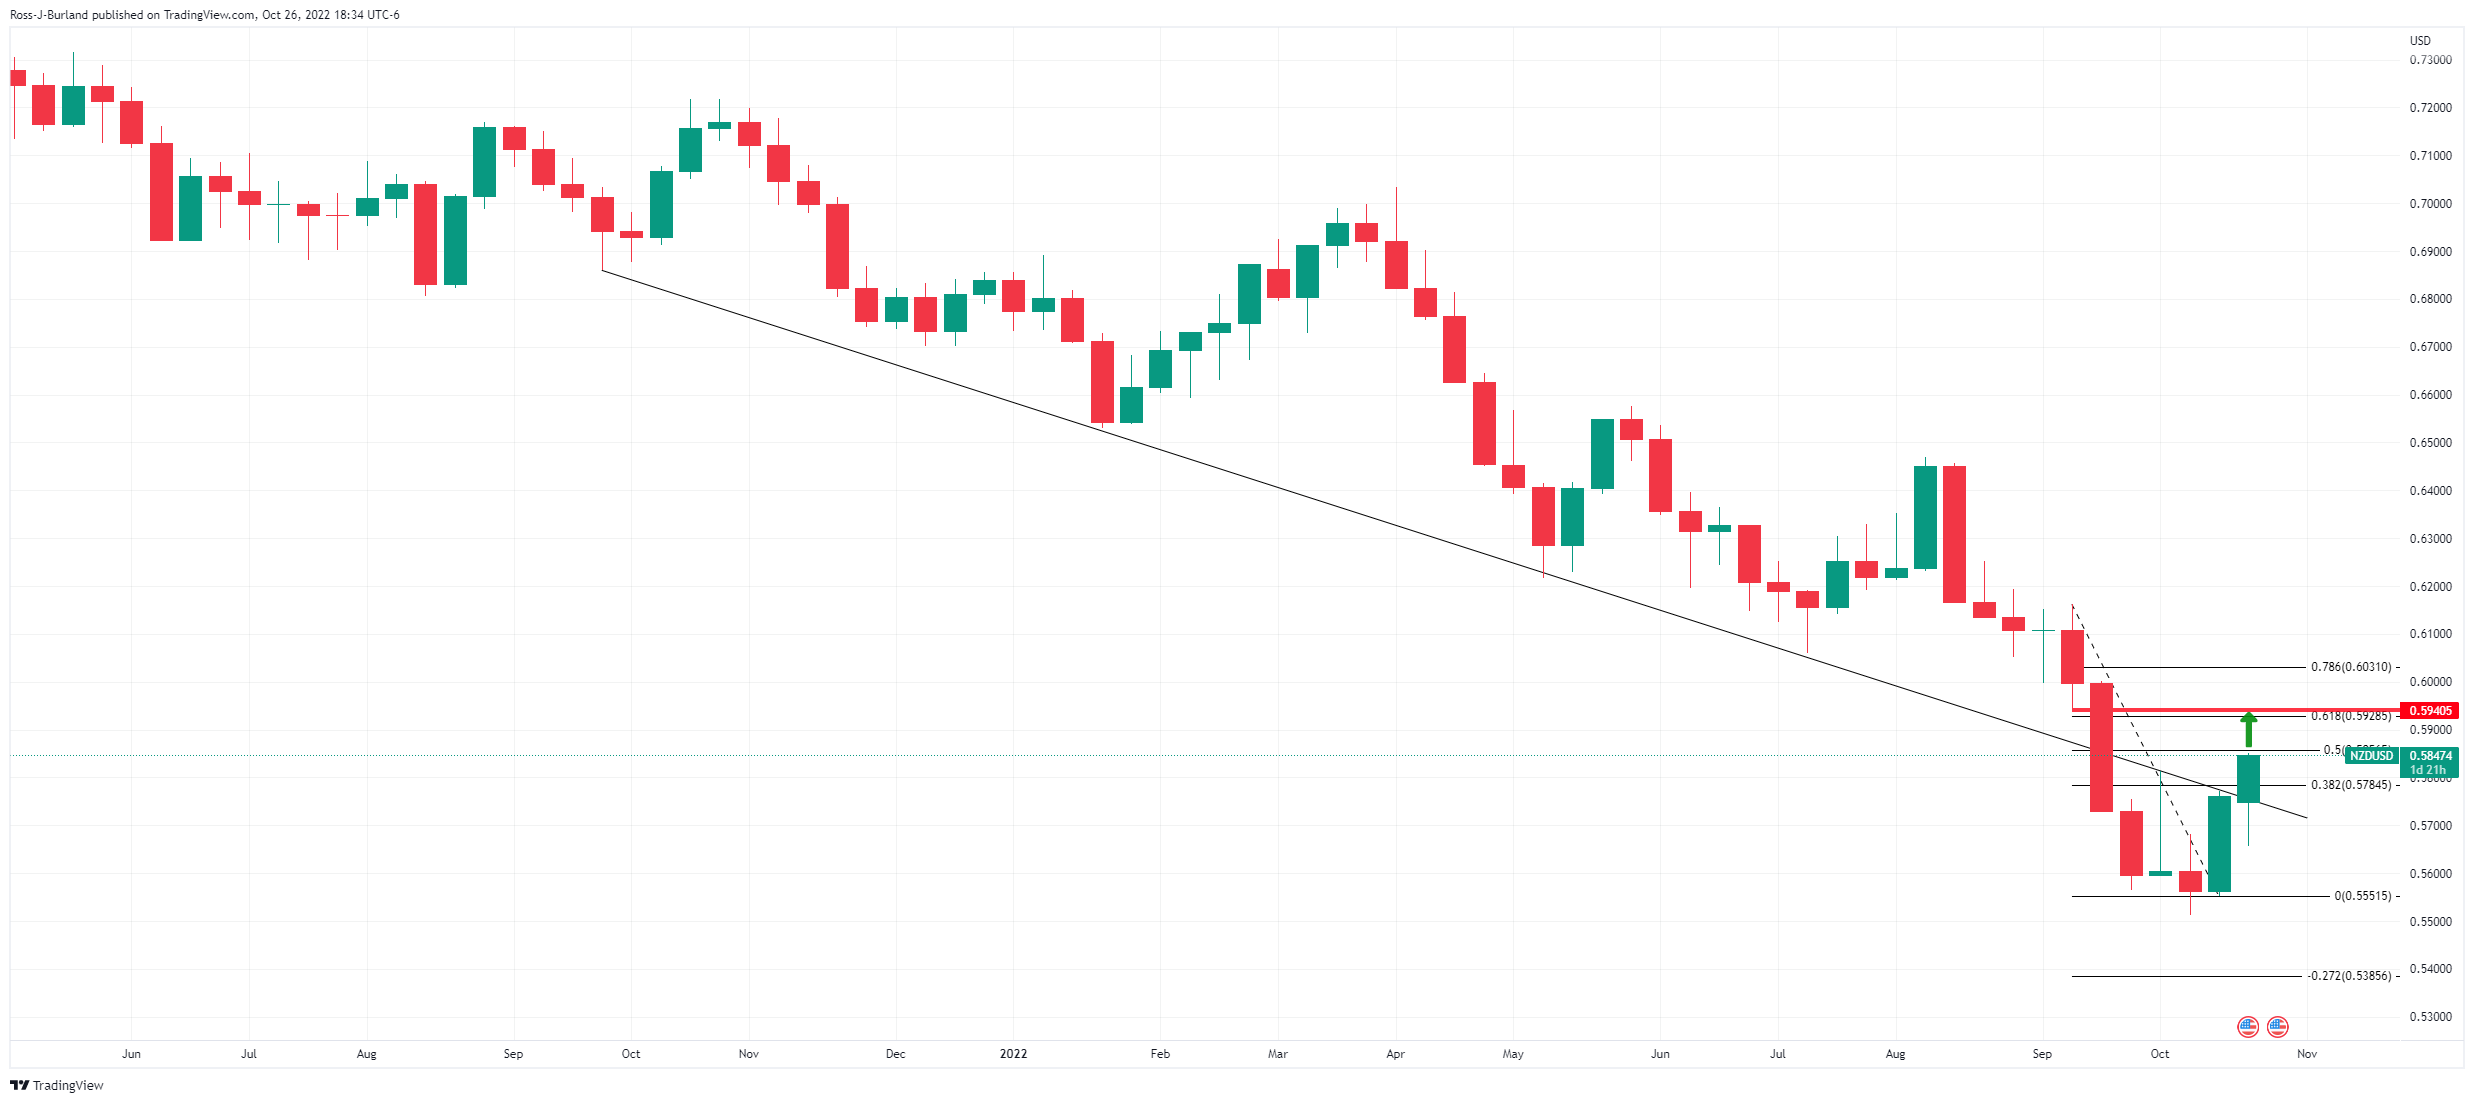
On the other hand, if the bulls commit, then the weekly 61.8% Fibo could be targetted near 0.5940 structure: