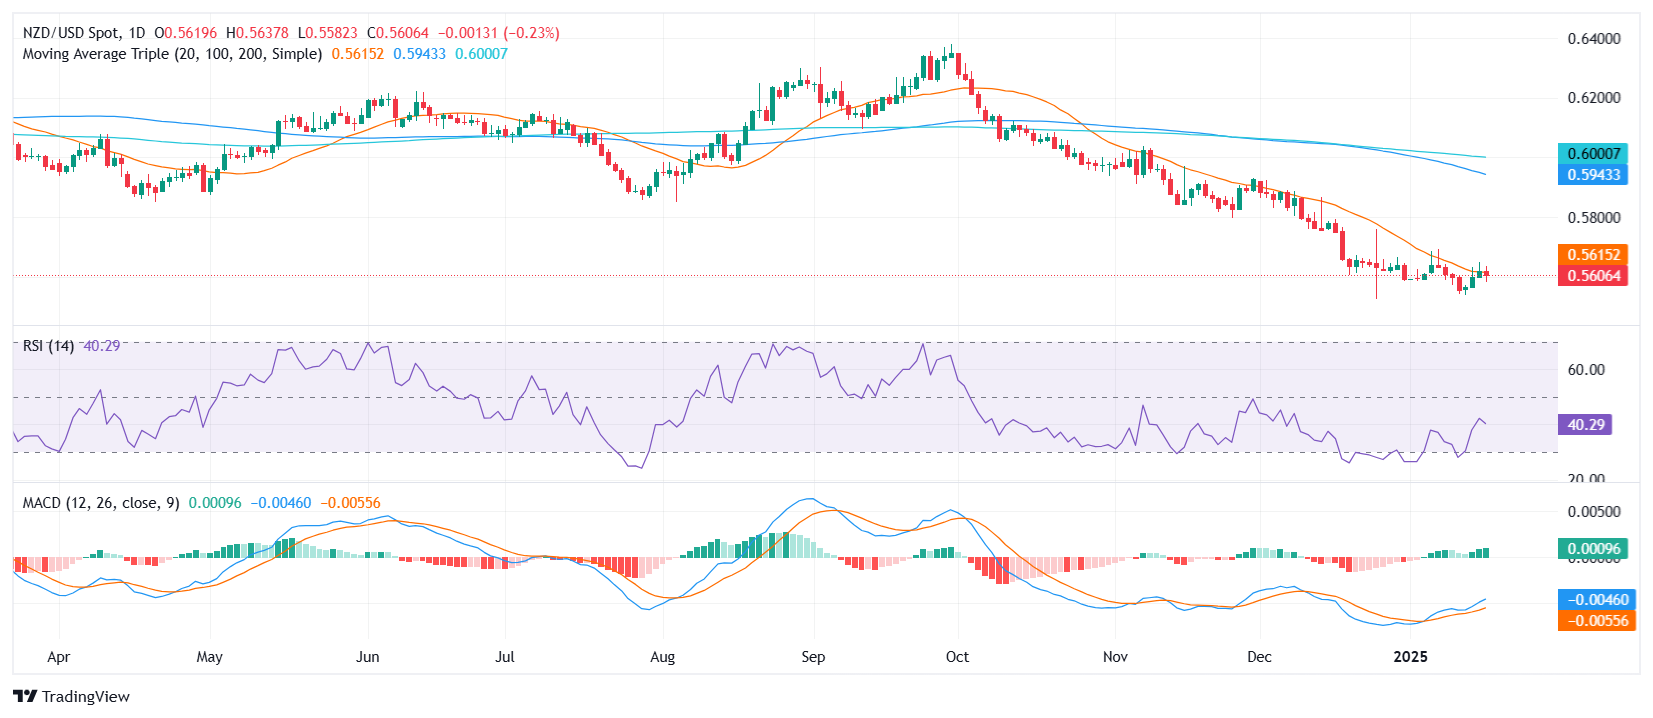
NZD/USD Price Analysis: Dip challenges support at the 20-day SMA
- NZD/USD eases on Thursday, hovering near 0.5610 in a cautious market mood.
- MACD histogram shows rising green bars, hinting at subdued but ongoing buyer interest.
- RSI sits at 45, slipping slightly yet staying within a mild negative zone.
The NZD/USD pair encountered modest pressure on Thursday, drifting 0.16% lower to roughly 0.5610. Despite this pullback, the exchange rate has managed to hold close to its 20-day Simple Moving Average (SMA), a signal that buyers could be attempting to build a floor under recent price action. While momentum remains tepid, the pair’s resilience at this critical threshold indicates a measured appetite for higher levels.
Technically, the Moving Average Convergence Divergence (MACD) histogram continues to print rising green bars, suggesting that, although not overwhelming, there is a degree of underlying demand. Meanwhile, the Relative Strength Index (RSI) has edged down to 45, reflecting a slight decline in bullish conviction without totally ceding ground to sellers. This delicate balance between optimism and caution leaves NZD/USD in a precarious spot.
Going forward, a sustained hold above the 20-day SMA near 0.5600 would underline the possibility of further gains, potentially guiding the pair toward the 0.5650 region. Conversely, a break beneath the immediate support could target 0.5580, with a deeper slide exposing 0.5550 if sentiment takes another negative turn.

