EUR/GBP Price Analysis: Six-week-old support trendline on seller’s radar
- EUR/GBP extends losses below 50-day SMA.
- 38.2% Fibonacci retracement, monthly falling resistance line limit near-term recovery.
- 0.8400 holds the key to the pair’s decline towards December low.
EUR/GBP drops to the intra-day low of 0.8486 by the press time of the pre-European session on Wednesday. The quote registered a daily closing below 50-day SMA the previous day for the first time since January 10.
As a result, traders are aiming to revisit an upward sloping trend line stretched since December 13, at 0.8468, a break of which will further drag the quote towards 23.6% Fibonacci retracement of the pair’s October-December 2019 declines, at 0.8454.
Given the increased selling pressure past-0.8454, 0.8400 and the year-start bottom surrounding 0.8365 can please the bears ahead of pushing them to December month low of 0.8276.
Meanwhile, buyers will wait for the pair’s daily closing above 50-day SMA level of 0.8509. In doing so, they will target a 38.2% Fibonacci retracement level of 0.8565 and descending trend line since December 25, at 0.8600.
If at all the EUR/GBP prices manage to clear the 0.8600 mark, it becomes capable of challenging late-October tops near 0.8680.
EUR/GBP daily chart
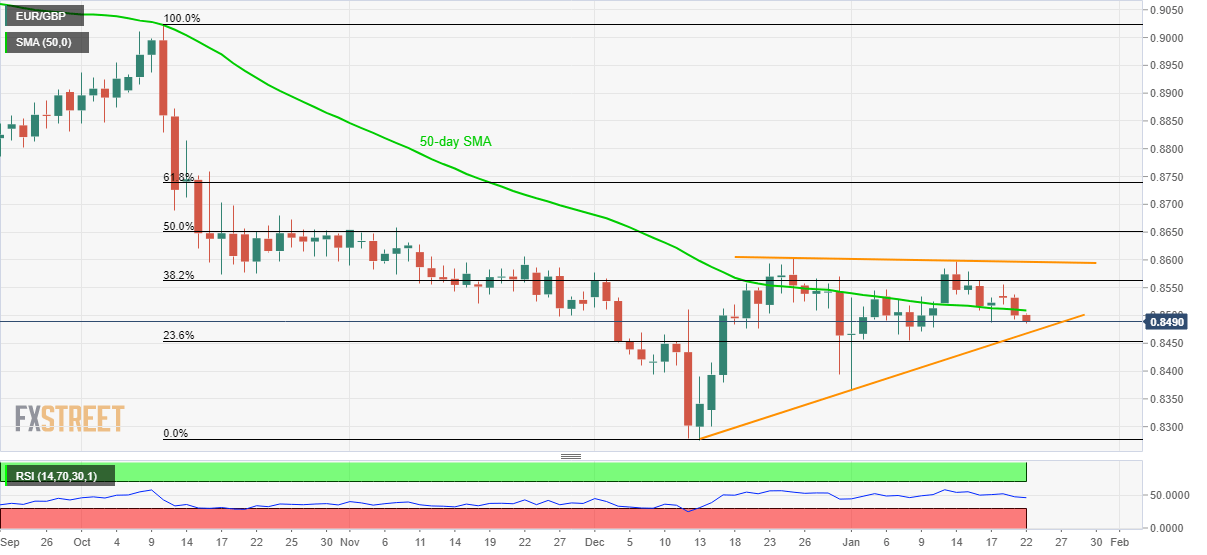
Trend: Bearish