Back
9 Mar 2020
US Dollar Index Price Analysis: DXY erases 2019 gains in three weeks, trades near 95.00 figure
- DXY selloff erased more than one year of trading in a matter of three weeks.
- The level to beat for bears is the 94.60 support.
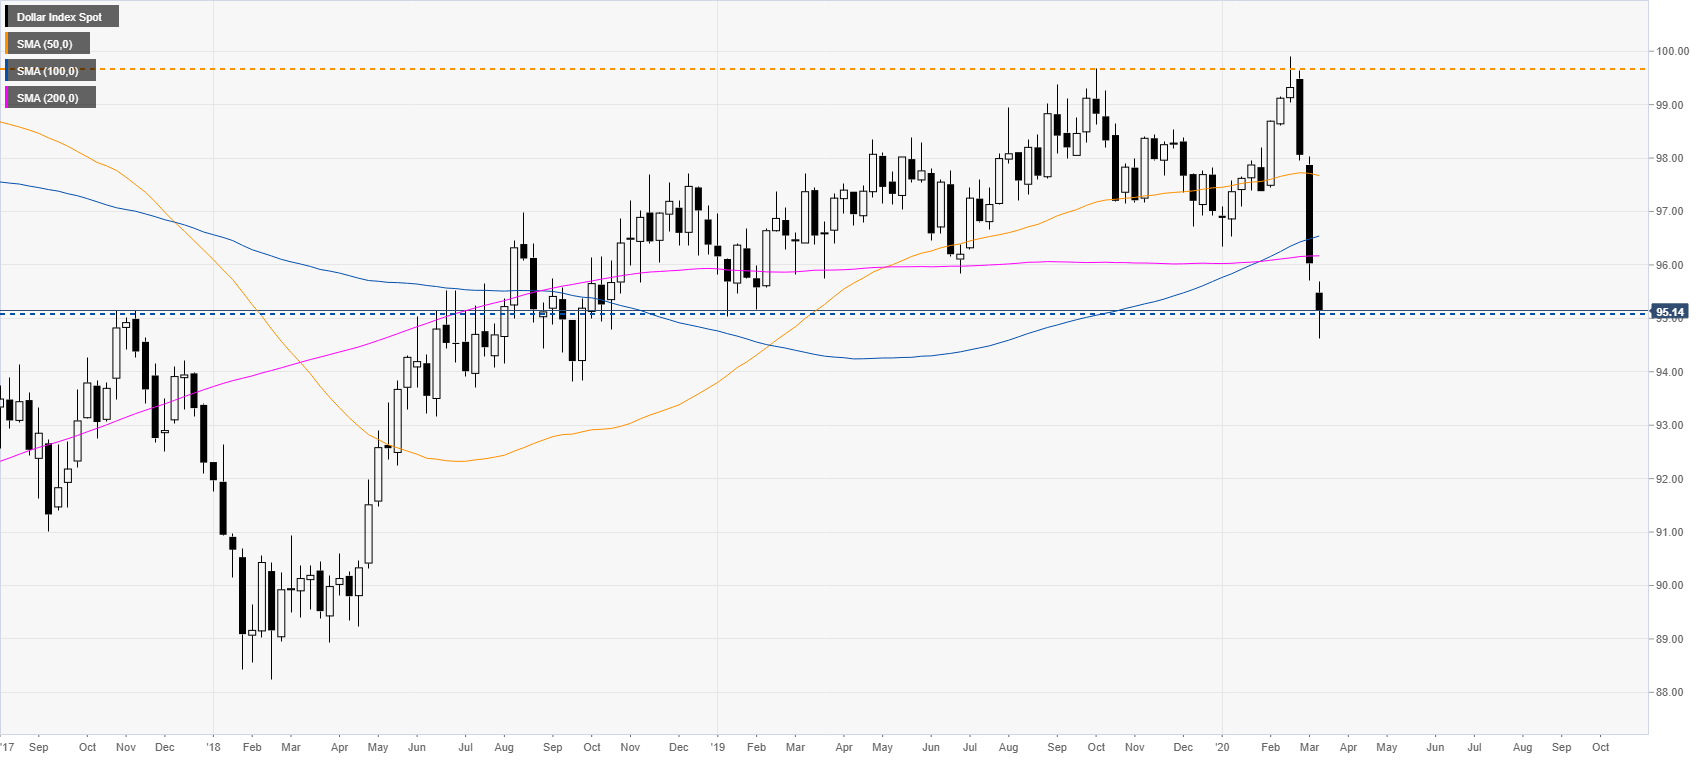
DXY weekly chart
The US dollar index (DXY) erased more than one year of gains in a matter of three weeks as falling equities and US bond-yields are weighing heavily on the US dollar. The Coronavirus is sending a wave of panic across the world and financial markets.
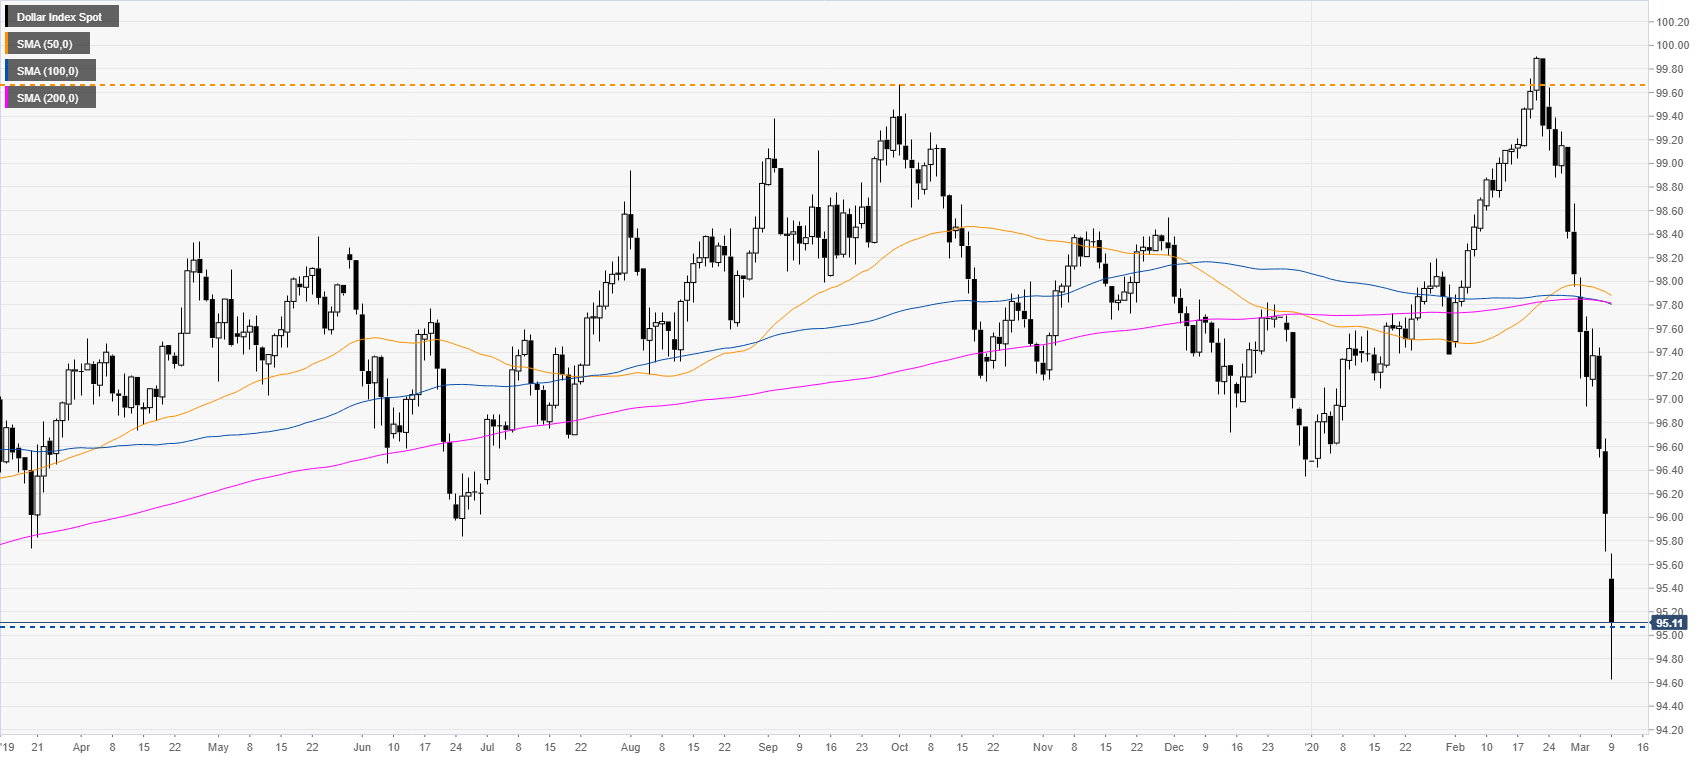
DXY daily chart
The greenback is trading off the 2019 low at 95.03 while trading well below the main simple moving averages (SMAs). There are no signs of respite as bears remain in control.
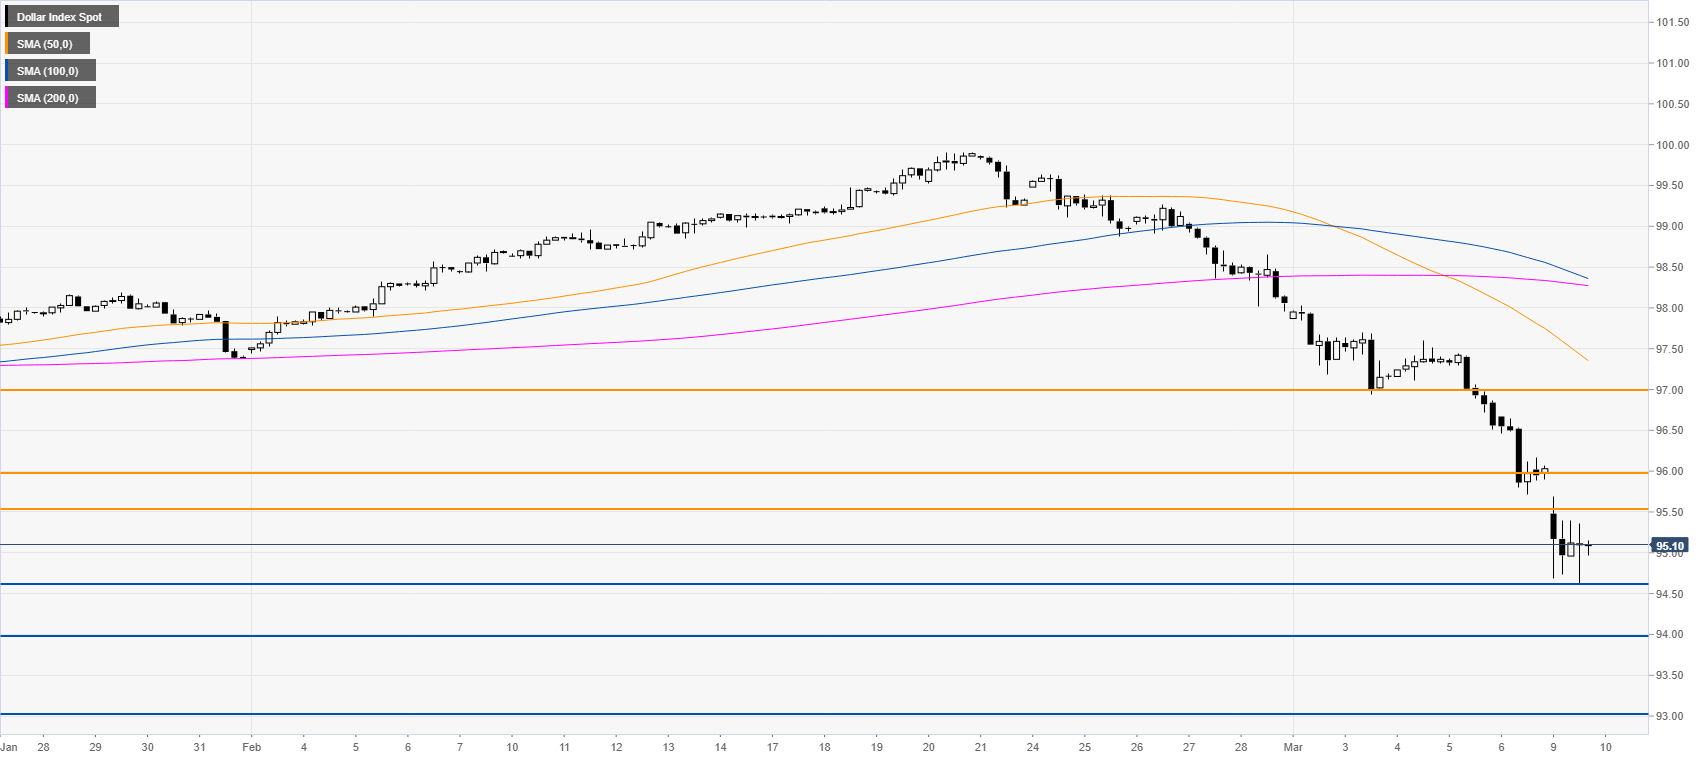
DXY four-hour chart
DXY bear trend remains intact below the main SMAs as the Index is printing fresh 2020 lows. Bears would be looking for a break below the 94.60 level to extend losses towards the 94.00 and 93.00 figures in the medium term.
Additional key levels