Back
16 Mar 2020
Silver Price Analysis: XAG/USD decimated, trading into 11-year lows near 13.00 figure
- XAG/USD is trading at its lowest since 2009.
- The level to beat for sellers is the 12.00 support.
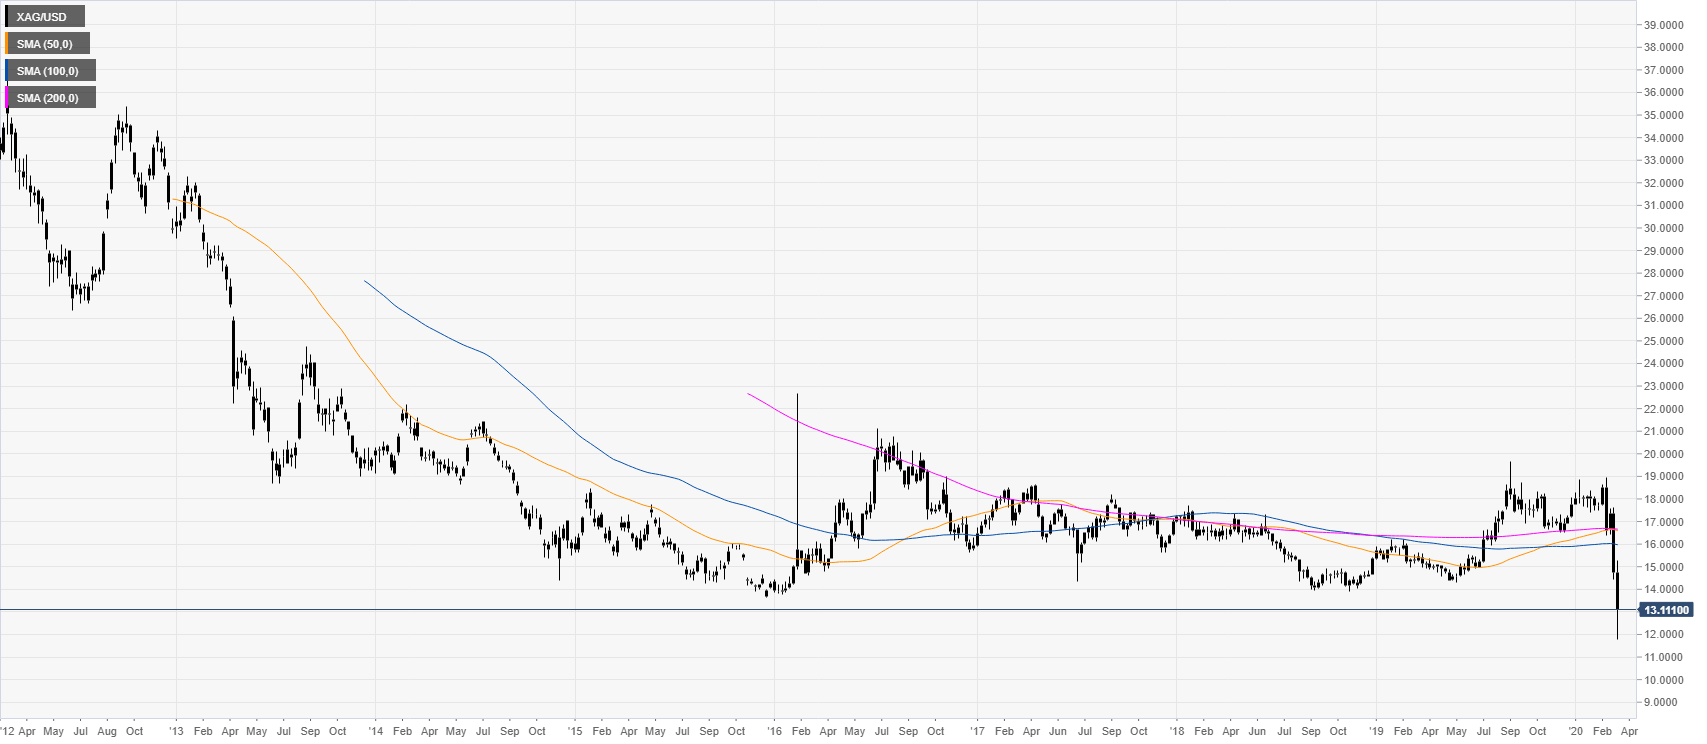
Silver daily chart
XAG/USD fell dramatically sending the metal to its lowest since 2009. The market is currently bouncing slightly near the 13.00 figure however, XAG/USD remains vulnerable to further selling. Despite the 100bps cut from the Fed, the metal can't find any traction.
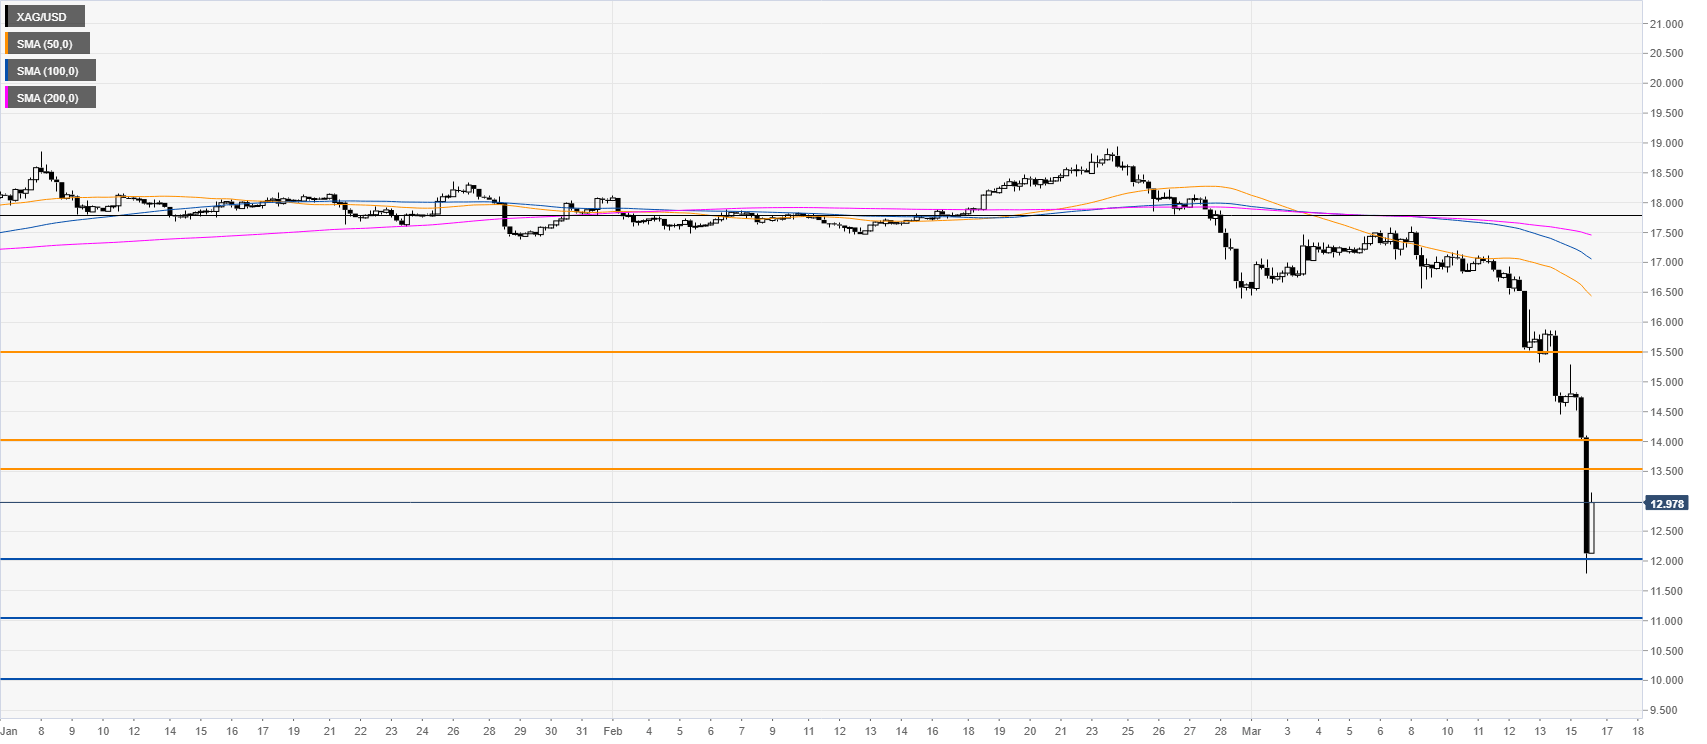
Silver four-hour chart
Silver is trading well below the main SMAs as sellers remain in full control. A break below the 12.00 figure can spark deeper losses towards the 11.00 and 10.00 price levels. Conversely, resistance is seen near the 13.50, 14.00 and 15.50 levels.
Resistance: 17.52, 17.80, 18.25
Support: 16.40, 16.10, 15.90
Additional key levels